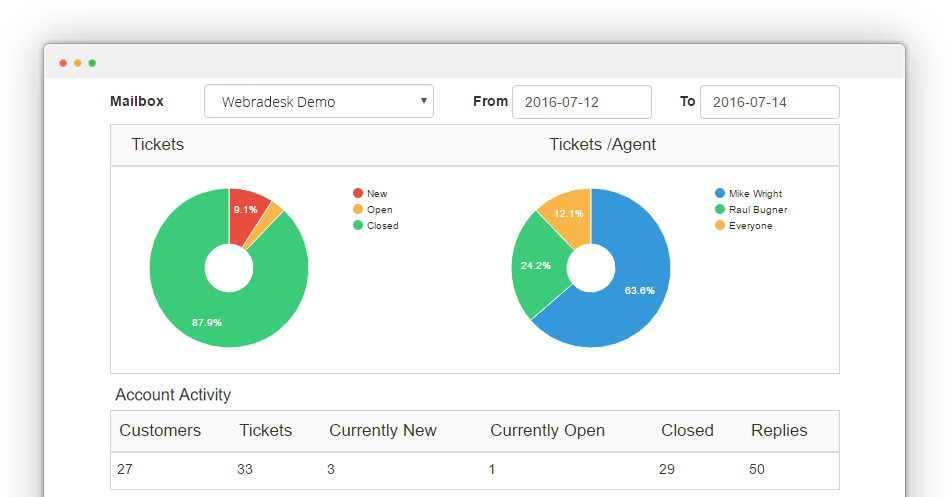
This page helps you understand your customer support activity at a glance. You can review the support activity by checking who’s solving the tickets and how many tickets are not yet solved. The number of customers and ticket replies are displayed so you can easily determine the workload for a certain period.
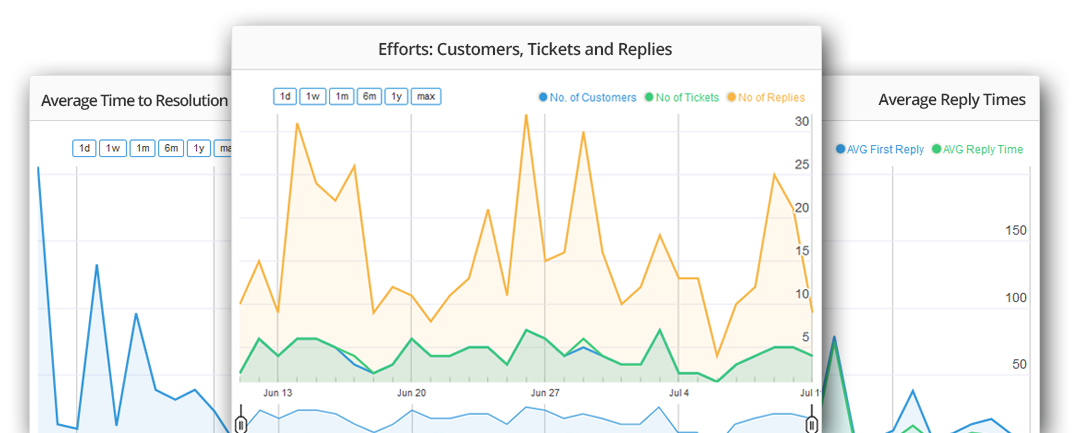
These standard charts show the distribution of the customer support workload over a certain period. They show how fast you respond to customers and how fast you provide solutions. You can also use them to identify trend changes and spot if you are solving customer problems faster or slower.
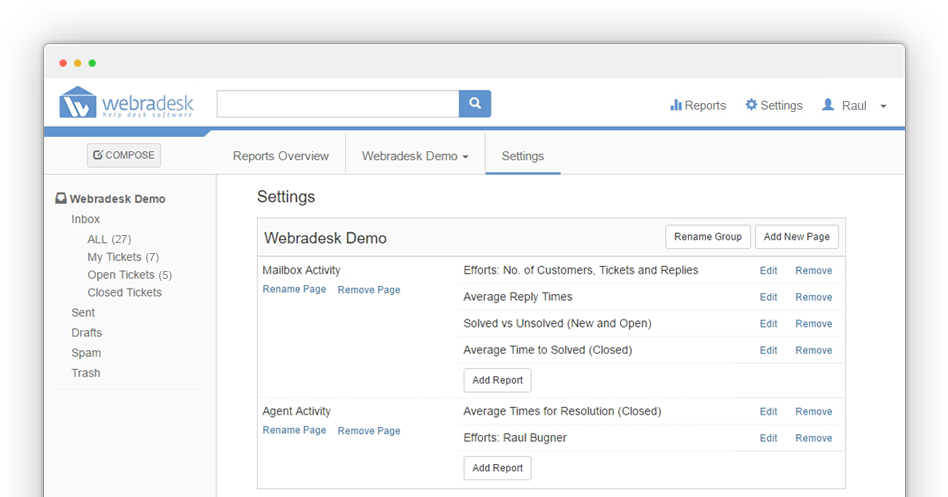
Measure the most important support activities for your brand. Define custom support metrics in order to better understand and act on key issues.